Cloud Observability Operations
Requesting access to Grafana
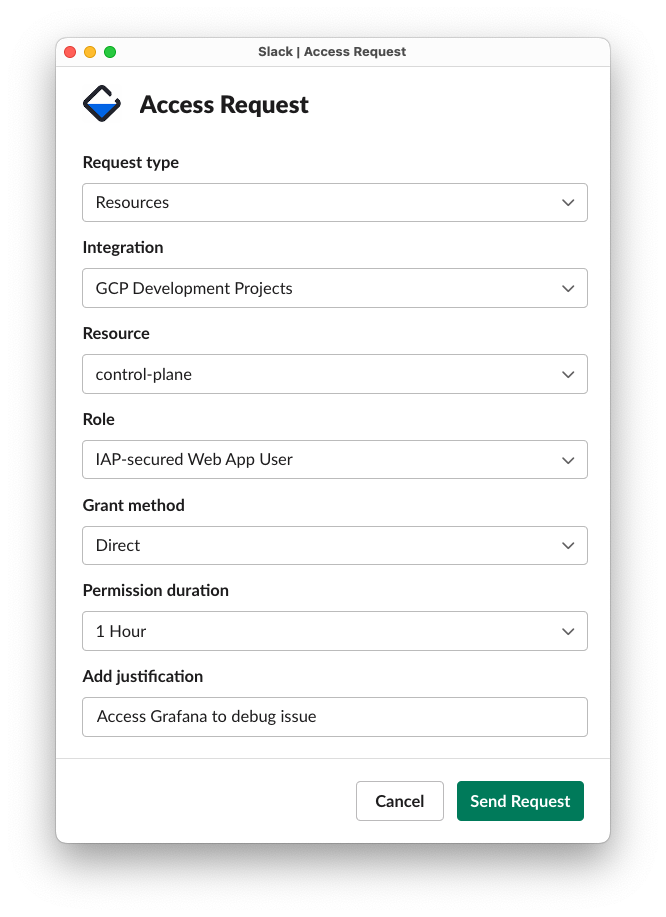
Users who do not automatically have access to the Grafana instance can request access through Entitle. On Slack, type /access_request and hit enter. Fill out the form wil the following values:

A Cloud team or Security team member will then need to approve the request. If you require permanent access to Grafana, please post a message in the #cloud channel on Slack and request a Cloud team member provision you access.
Granting a user permanent access to Grafana
User management is provisioned within GCP. To grant a new user permanent access to Grafana they will need to either be added to an approved group or have their identity specifically added to the IAP proxy.
To add a user, navigate to the GCP Console IAP management page for Grafana. Click the check box and the provisioning page should appear on the right. From there, click “Add Principal” and add the user.
Manually regenerate Grafana dashboards
Grafama dashboards are generated when the centralized-o11y invariant is run against an instance:
- Cloud team members can run
mi2 instance check -e $ENVIRONMENT -s $SLUG -enforce centralized-o11ylocally. This will automatically generate an ID token, generate, and upload the dashboards to Grafana.
Creating a new individual dashboard
The dashboards for Cloud customers are generated from the same dashboard definitions that are create the bundled dashboards included with all Sourcegraph distributions. To create a new dashboard that will be rolled out to all managed instances, follow the Developing Observability guidelines.
Creating a new multi-instance dashboard
We are now able to see the value of a query applied to multiple instances at once. To create a dashboard that queries multiple customers at once, log into Grafana and use the native creation tools. It’s recommended to start with an existing dashboard panel, click the title, and selecct “Explore”. This will allow you to modify the prewritten query. All Cloud instances support the same set of metrics and are tagged with additional metadata to denote the customer.
To view the results for a specific subset of customers, duplicate the query and filter each result for a given customer by changing the project_id= label selector.
If the project_id is unknown for a given customer, follow the FAQ: How do I figure out the GCP Project ID for a customer? instructions.
NOTE: Custom created dashboards should persist through restarts however the Cloud team guarantees no SLAs. If a dashboard is mission-critical, please communicate with the Cloud team on getting it added as a permanent fixture. It’s preferred that all dashboards are created in code and distributed as part of Sourcegraph itself.
Metrics that use Prometheus aggregation functions (like sum by) will need to be updated to include the project_id as a a grouping field, e.g.:
sum by (job) (pg_stat_activity{project_id="sourcegraph-managed-sg"})
would become
sum by (job, project_id) (pg_stag_activity)
to show the metric for all instances, labeled by their project_id.
These dashboards will be pregenerated in the future.